The Area Under the Margin (AUM) Statistic
Quick Links
Motivation
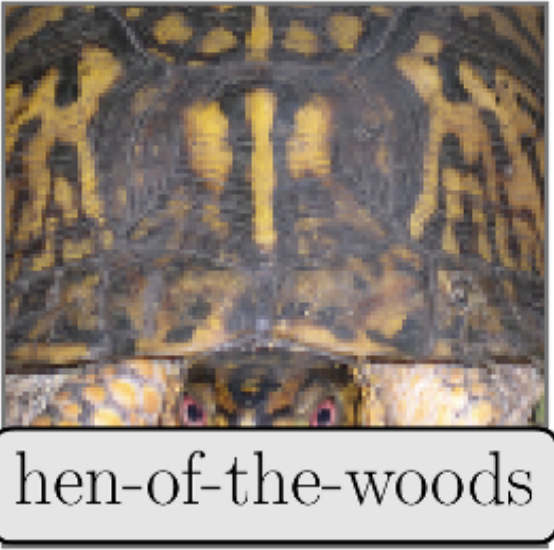
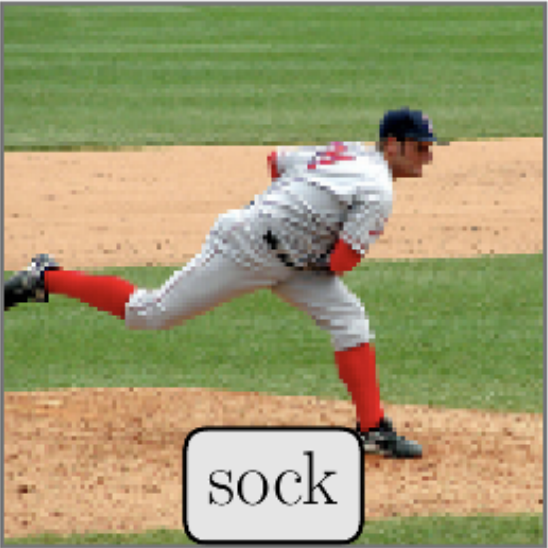
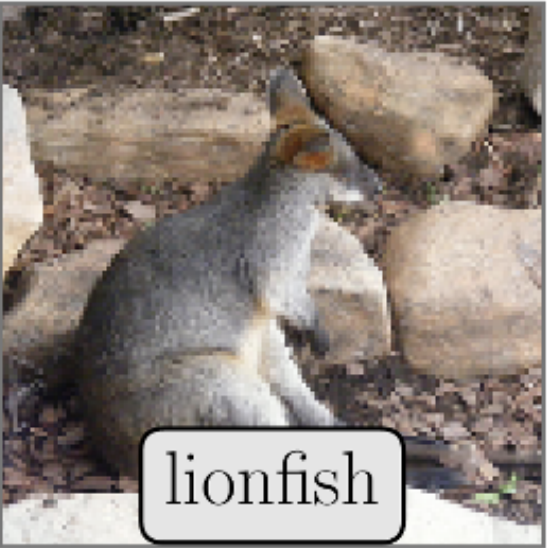
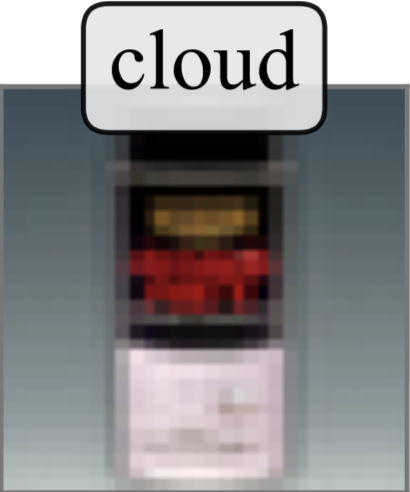
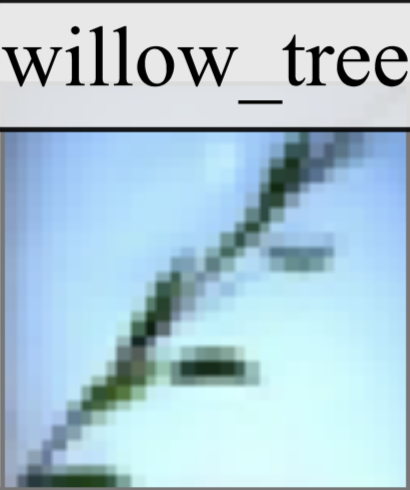
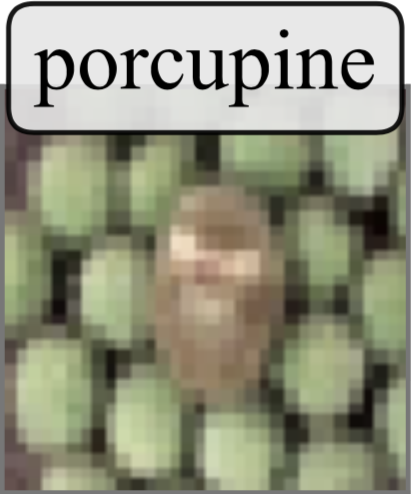
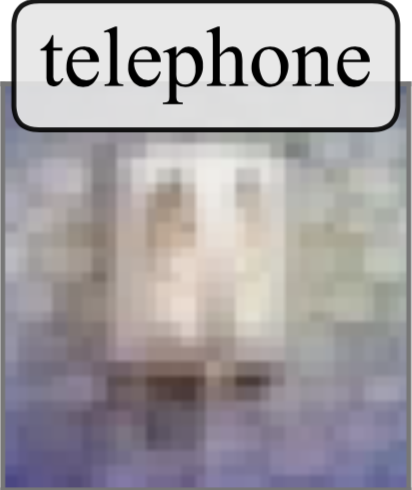
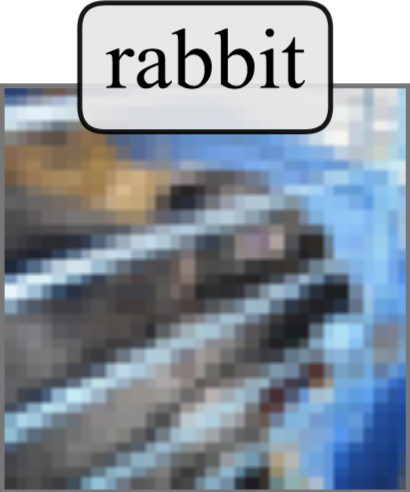
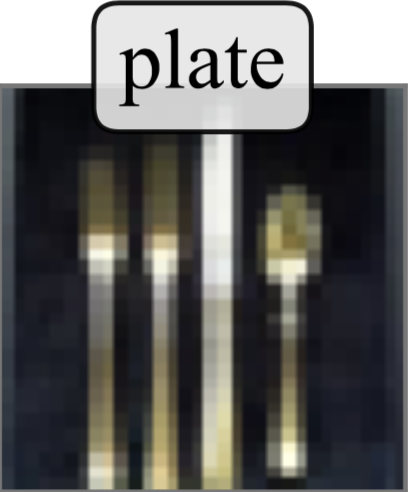
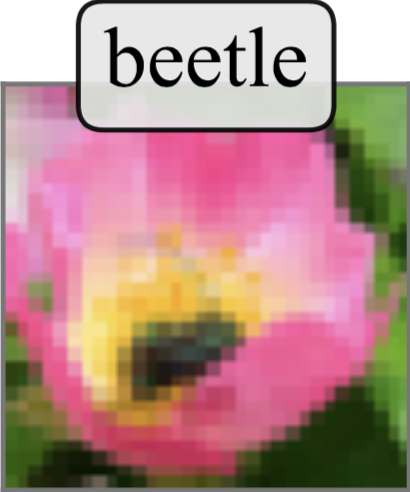
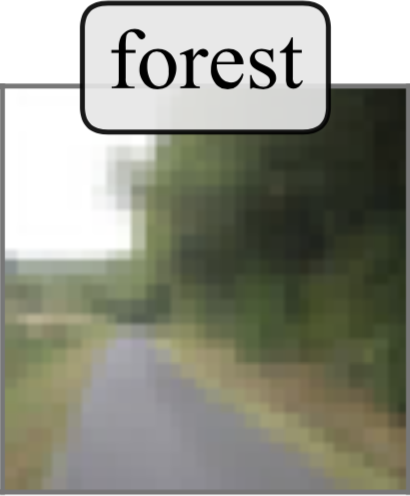
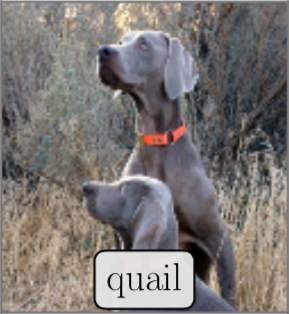
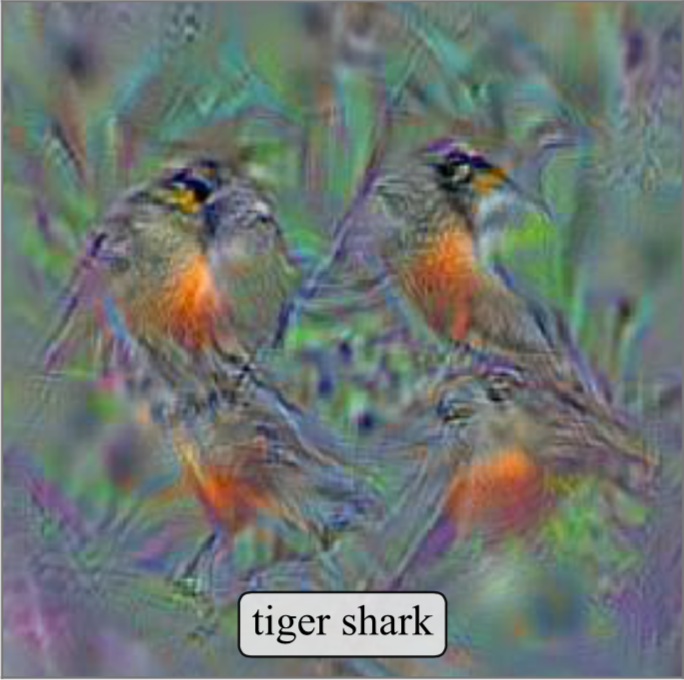
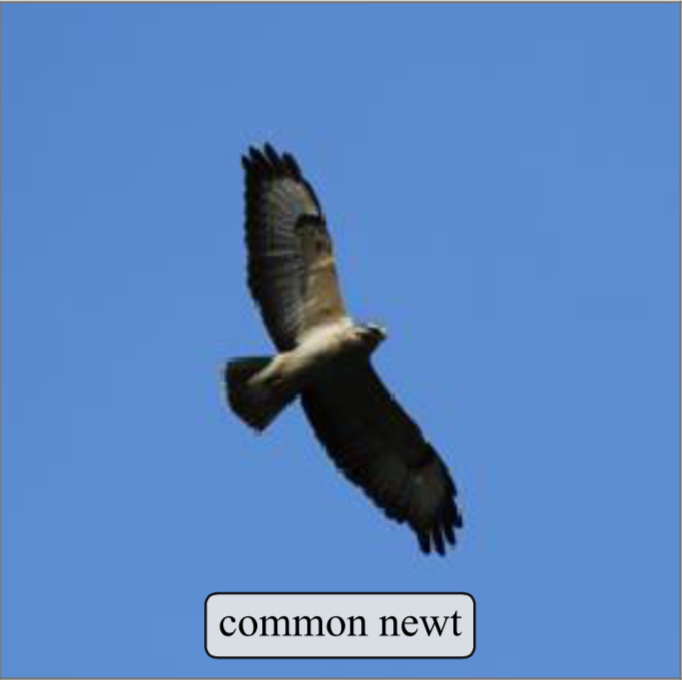
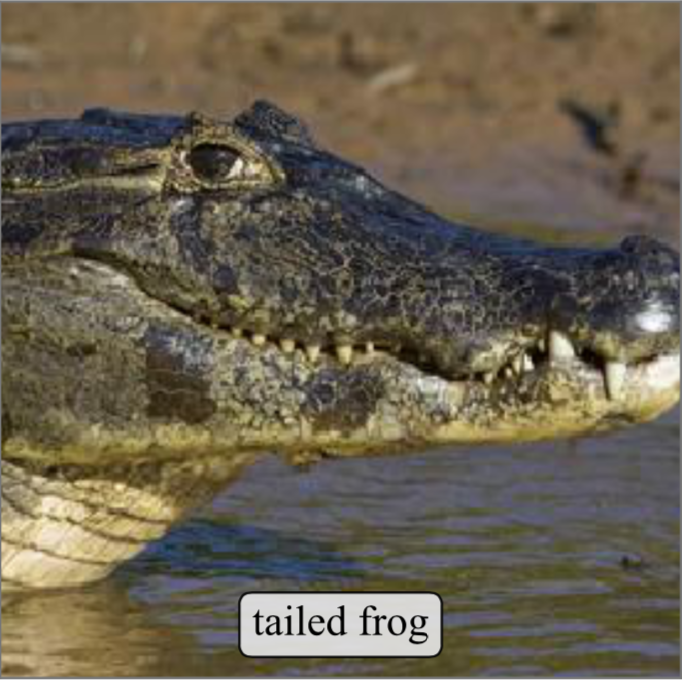
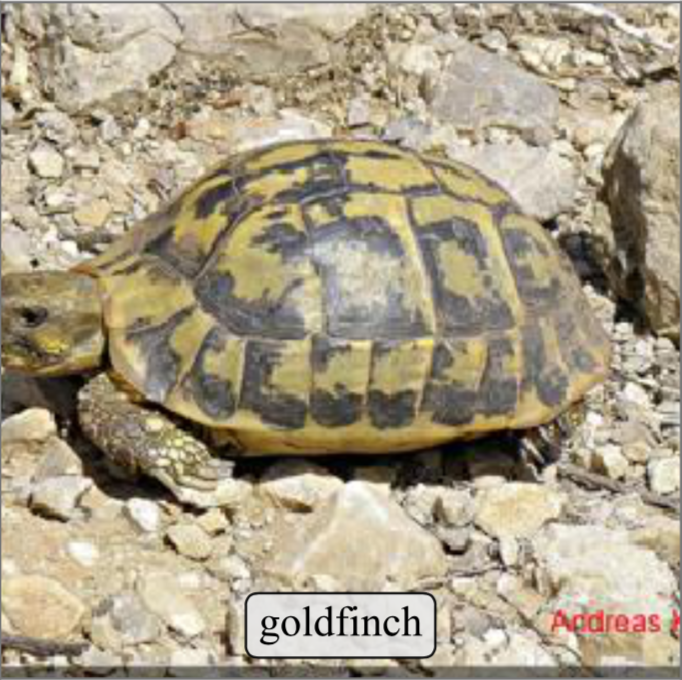
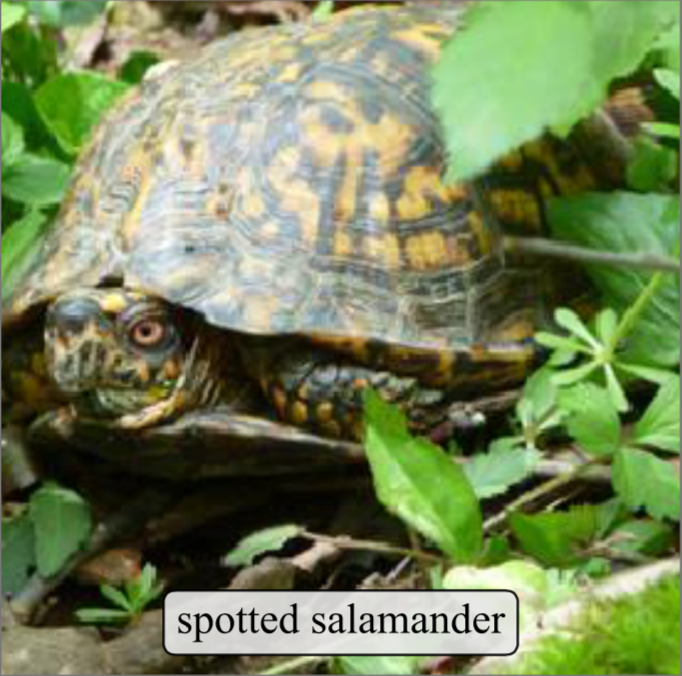
Even the most high-power neural network architectures will be prone to error if trained on mislabeled or highly-ambiguous data. Some datasets—especially those that are "weakly-labeled" or annotated by vendor services—are succeptible to such examples. Even some of the most commonly-used datasets, like MNIST and ImageNet, contain several mislabeled examples:
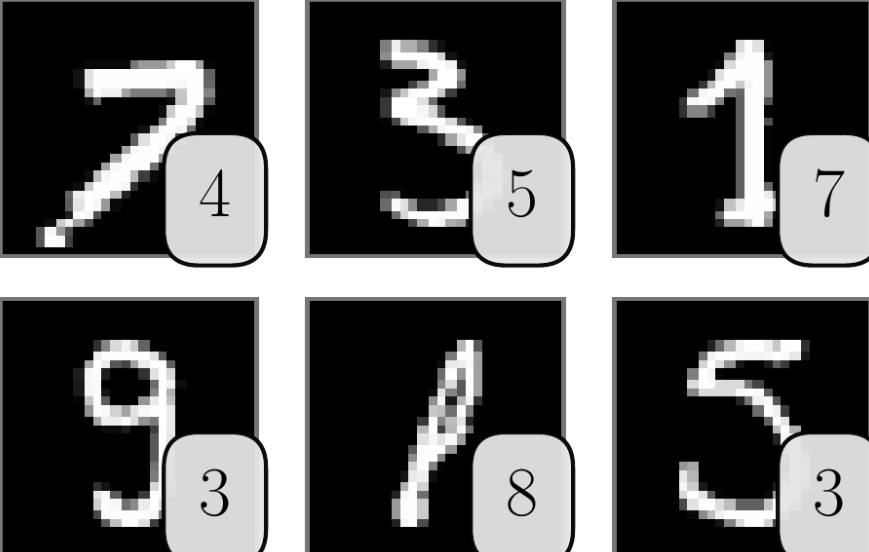
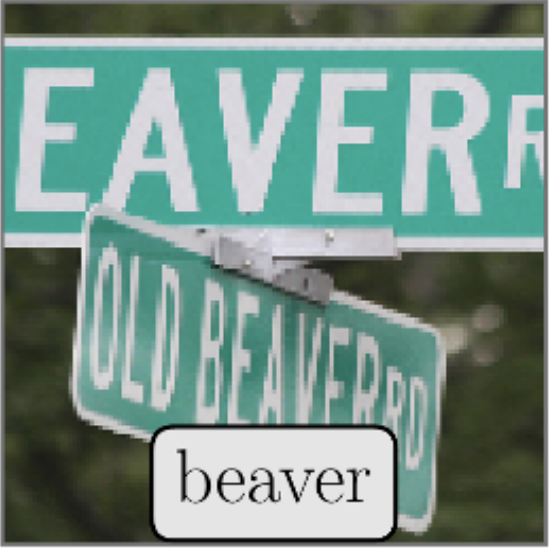
Modern neural networks have sufficient capacity to memorize these mislabeled examples. This memorization will hurt generalization, and thus is a bottleneck limiting the performance of these models. To combat this, we wish to identify and remove samples that are mislabeled, highly-ambigouous, or otherwise harmful to generalization.
The Area Under the Margin (AUM) Statistic
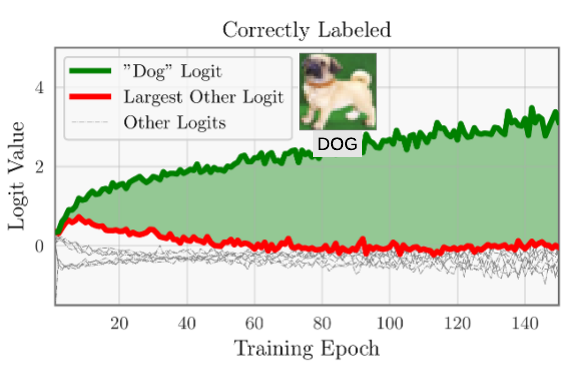
Mislabeled samples hurt network generalization, while clean samples help generalization. One simple metric that has been shown to be strongly correlated with neural network generalization is the margin. At epoch ..., the margin of sample ... is defined as:
Intuitively, the margin for any given sample is affected by two forces.
- its own gradient updates; and
- gradient updates from similar (generalizable) samples.
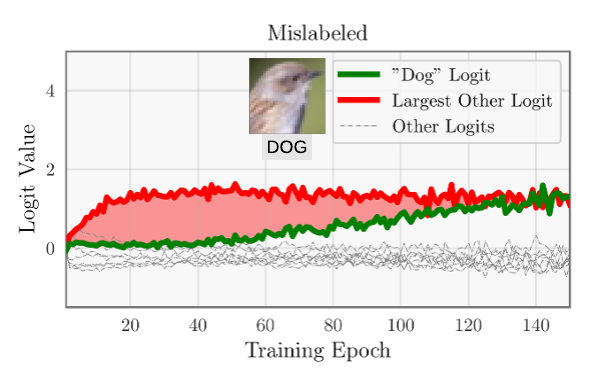
If a sample is correctly labeled, these two forces amplify one another to improve the margin. However, these forces are opposed for mislabeled samples. The first force increases the (incorrect) assigned logit while the second force increases the (hidden) ground-truth logit.
We therefore expect that—on average—a mislabeled sample has a lower margin than a correctly-labeled sample. We capture this by averaging the margin for a given sample over all ... training epochs:
This statistic is referred to as the Area Under the Margin, or AUM. It is illustrated in plots above, which plots the logits over time for two training samples. The correctly-labeled sample have large margins, corresponding to a large AUM (green region). The mislabeled sample has a negative margin for most of training, corresponding to a very negative AUM (red region).
Noteworthy Results
CIFAR100
We identify 13% of training data that might be mislabeled/ambiguous/harmful to generalization. Simply these data improves error (with a ResNet-32) from 33.0% to 31.8%.
ImageNet
We identify that 2% of ImageNet data is potentially mislabeled. (This low number is expected, due to ImageNet's rigorous annotation process.) Removing these data does not significantly change ResNet-50 error.


WebVision-50
This dataset is a standard benchmark for "weakly-labeled" learning. We identify and remove 17% of the data, improving accuracy from 21.4% to 19.8% with a ResNet-50 model.


Code
We offer a simple PyTorch library (written by Josh Shapiro) for computing the AUM statistic:
pip install aum
This module provides a wrapper around standard PyTorch datasets, as well a as a mechanism for recording the AUM statistic from classification logits. It can be incorporated into any PyTorch classififer in ~10 lines of code.
model.train()
for batch in loader:
    inputs, targets, sample_ids = batch
    logits = model(inputs)
    records = aum_calculator.update(logits, targets, sample_ids)
    # ...
List of Mislabeled Examples in CIFAR
The following are list of highly-suspicious/low-quality samples identified in the CIFAR dataset. It countains the training set index, the assigned-class label, as well as the AUM score.FAQ
How do i determine which samples are mislabeled from the AUM statistic?
AUM provides a ranking of all training points (lower = more likely to be mislabeled). To learn an AUM value that separates clean and mislabeled data, we provide a method of threshold samples (described in Section 3 of the paper). Alternatively, if you have access to a clean validation set, you can run a grid search to find the optimal AUM threshold.
References
Pleiss, G., Zhang, T., Elenberg, E. R., & Weinberger, K. Q. Identifying Mislabeled Data using the Area Under the Margin Ranking. In Neural Information Processing Systems (2020).
- Paper on ArXiV
- Code (written by Josh Shaprio)